- DeGeCI 1.1 uses a reference database of a large collection of complete mitogenomes of different taxonomic groups from the RefSeq data repository, which is represented as an annotated colored de Bruijn graph.
- Given a user-supplied mitogenome, the set of all substings of length (k+1), i.e., (k+1)-mers, contained in the sequence is generated.
- From this input genome graph, the induced subgraph of the database graph is created. That is, the subgraph consisting of all vertices and edges contained in both the database and the input genome graph.
- Unmatched segments in the input sequence result in separate components in this subgraph. These are bridged by alternative trails of the database graph that have a high sequence similarity to the unmatched segments.
- Lastly, an agglomerative clustering routine is applied to aggregate the gene annotations of the database sequences annotated in the subgraph, producing the final gene predictions.
- Optionally, the boundary positions of these predictions can still be refined. This is done, if a genetic code is supplied on submitting the input data (see Advanced parameters for details).
The only required input is the nucleotide sequence that is to be annotated by DeGeCI. This sequence can either be supplied as:
- FASTA file
- or sequence string.
There is a button (OR), which allows you to toggle between both input options.
Valid nucleotides are A,C,G,T,N,K,M,B,V,S,W,D,Y,R, and H. All other characters not contained on lines starting with '>' are removed from the input (including control characters).
In general, the default parameter settings of DeGeCI proved to produce good results for a broad specturm of different taxonomic lineages. If you are, however, not satisfied with the annotation, or have additional information about the genome sequence, you are welcome to fine tune these settings by clicking on the Advanced paramaters button. This will expand a content pane in which several settings can be adapted. This includes:
- Edge weight: Minimum number of genomes that must contain a (k+1)-mer for its edge to be included in the graph. The larger the weight, the larger the degree of conservation in the subgraph.
Allowed vallues: Integer values >= 1.
Default is 1. - Prediction count: Minimum number of database entries predicting a certain annotation for the annotation to be taken into account.
Allowed values: Integer values >= 1.
Default is 2. - Alpha: Cutoff paramter to determine the highest relative frequency of the RFD (relative frequency distribution) that must at least be obtained by a cluster to get selected from the dendogram.
Allowed values: All values in [0,1].
Default is 0.7. - Genetic code: Optionally, the translation table can be specified for the input genome. This may improve the gene boundary precision.
Default is "not specified". - Circular: Checkbox to specify if the input genome is circular. If unchecked, the input genome is treated as linear.
Possible use cases for this filter include analyzing which genes have been conserved in the input genome with respect to certain taxonomic groups or studying the impact of specific taxonomic groups on the quality of the results.
How does this filter affect the runtime?
The output produced by DeGeCI includes:
- A BED file containing the gene annotation for the supplied input genome. The end positions in the produced BED file are exclusive.
- A text file containing the gene order, i.e. the gene names in the order of their appearance on the genome. This can be used for genome rearrangement analyses (e.g., with CREx).
- A file containing the subsequences of the detected genes (file extension faa).
- A text file containing the employed parameter settings.
- A png file of the genes in the genome.
Runtime parameters: Of the runtime parameters, the edge weight has the largest impact. Increasing it, results in an increasing number of unmatched regions in the initial subgraph and therefore increased bridging times.
Taxonomic filter: In general, we have found that choosing the filter in a way to exclude all closely related species, on average triples the running time. This is because, there will generally be large unmatched regions in the initial subgraph, due to the more distinct species used for the annotation. This in turn causes high bridging times. In contrast, choosing the filter in a way to include only closely related species, generally results in comparable running times to those without a filter, with a slight tendency towards shorter times.
To provide the user with a rough estimate for concrete times, we have measured the runtimes for a sample of 100 complete mitogenomes, comprising seven major Metazoan groups (see table below). The times were measured using the default parameter settings, mitogenomes with an average length of 16,500 nt, and no taxonomic filter.
| Taxonomic group | Mean time [min] |
|---|---|
| Actinopterygii | 2.58 |
| Amphibia | 5.60 |
| Arthropoda | 2.54 |
| Mammalia | 3.27 |
| Non-bilaterian species | 1.54 |
| Sauropsida | 5.10 |
| Spiralia | 4.29 |
- Genomes for the reference database are from the RefSeq data repository
- The phylogenetic tree for the taxonomic filter is derived from the NCBI taxonomy database
- There are various sites available for interactively exploring the produced bed file. Some examples are:
BioViz
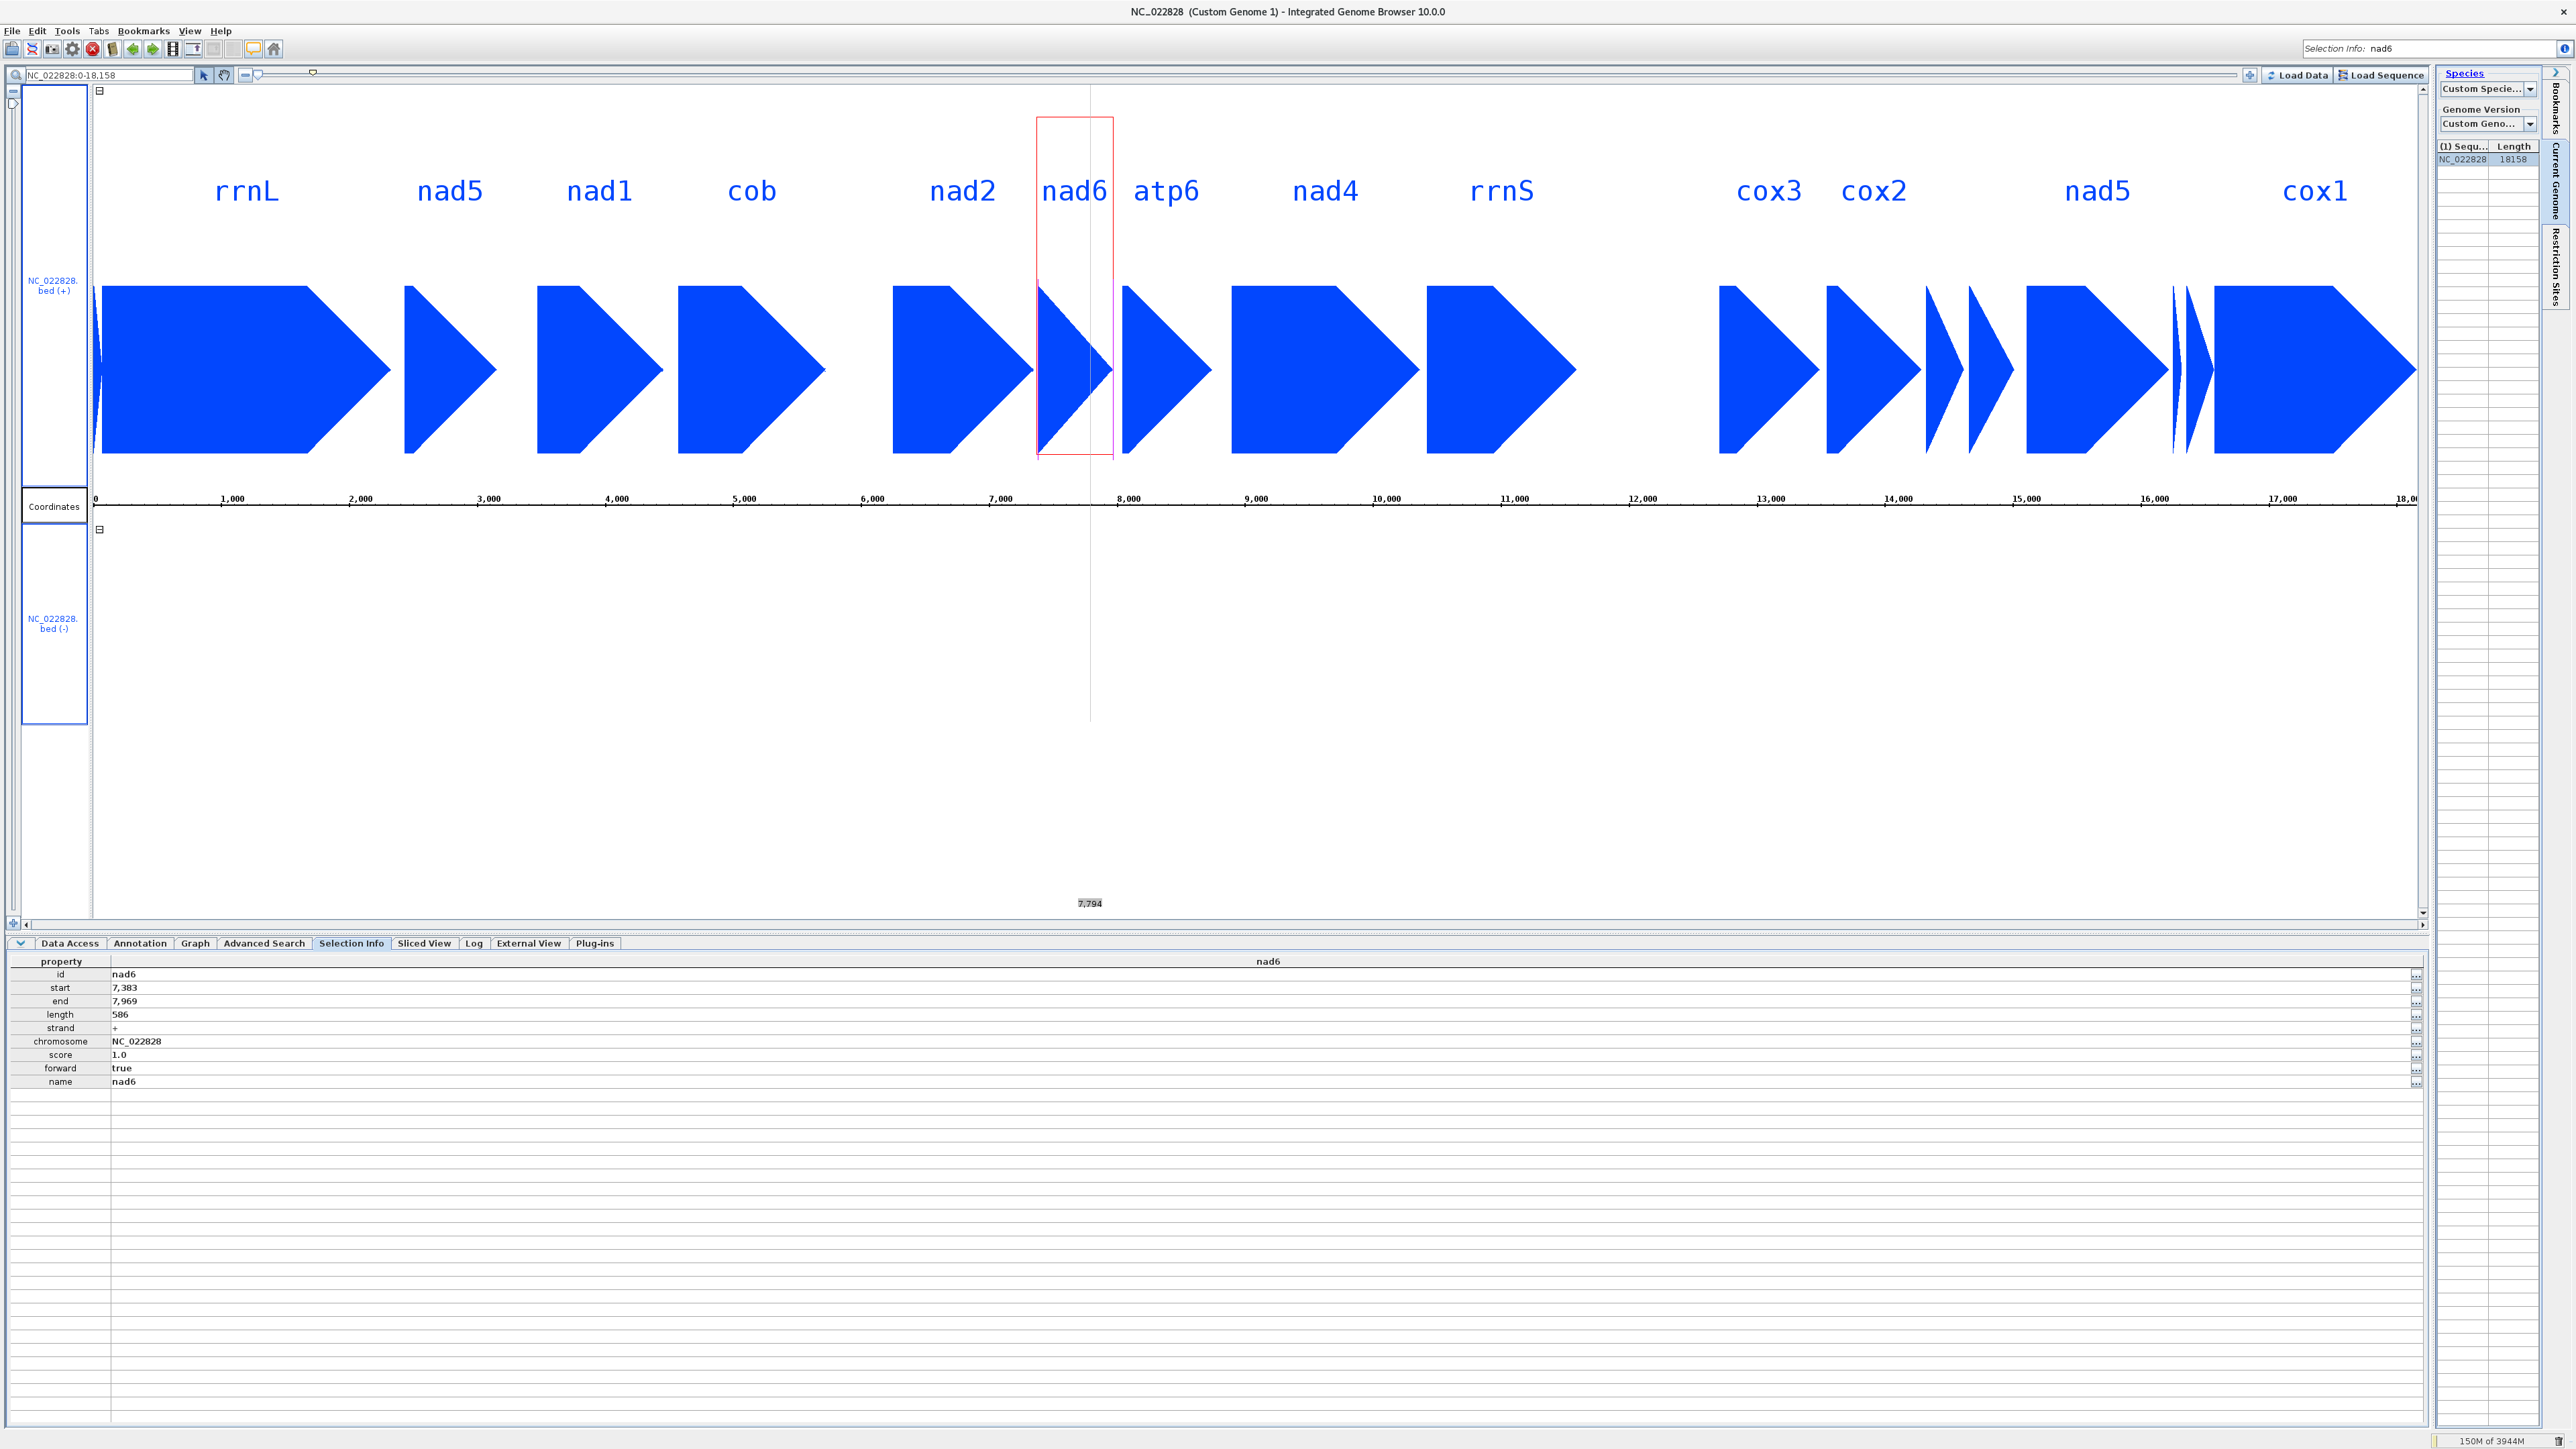
BioVIZ Viewer output for mitogenome NC_022828 of the DeGeCI annotation example. The annotated genes are displayed in the main view. This view is separeted into two sections, one for each strand. In this case all genes are annotated on the positive strand (upper section). A slider on the top allows zoomig. The nine tabs at the bottom of the viewer show additional information. For example, the Selection info tab summarizes details of the currently selected gene (red box, here nad6).Instructions
- Go to BioViz and click "Install IGB" in the top right corner.
- Install the software by launching the install script (takes less than a minute).
- Go to "File" and select the genereated BED file by DeGeCI 1.1 (the file with extension "bed").
- Click the "LOAD DATA" Button in the top right corner (the software also informs you in a popup window to do this).
IGV
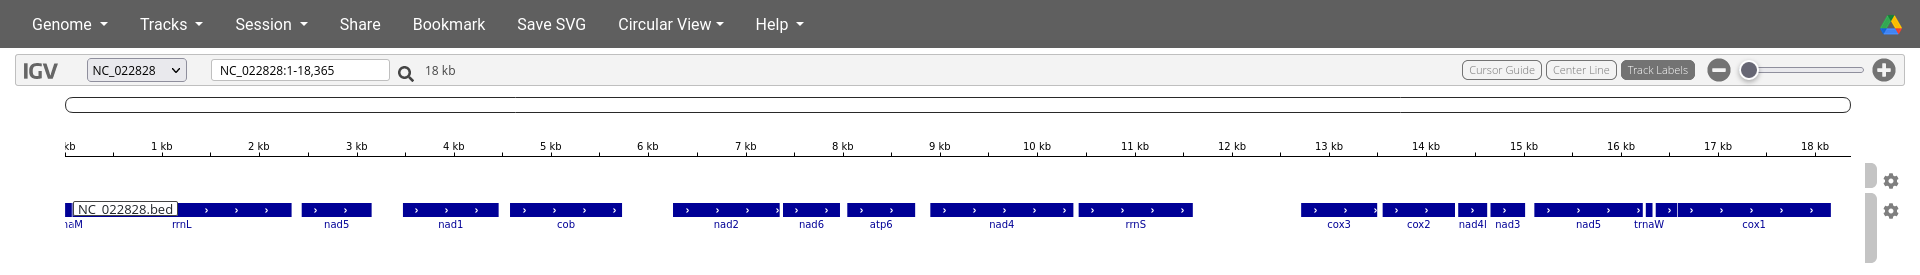
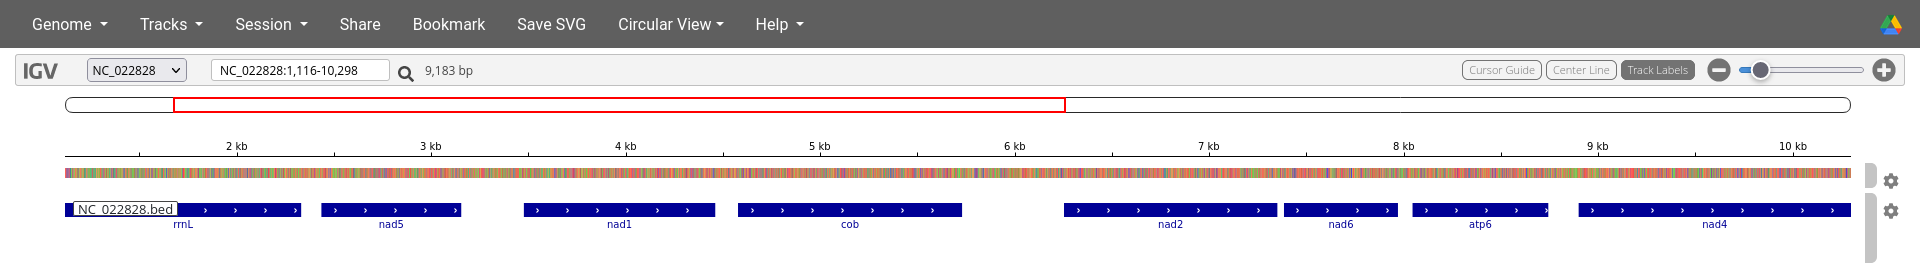
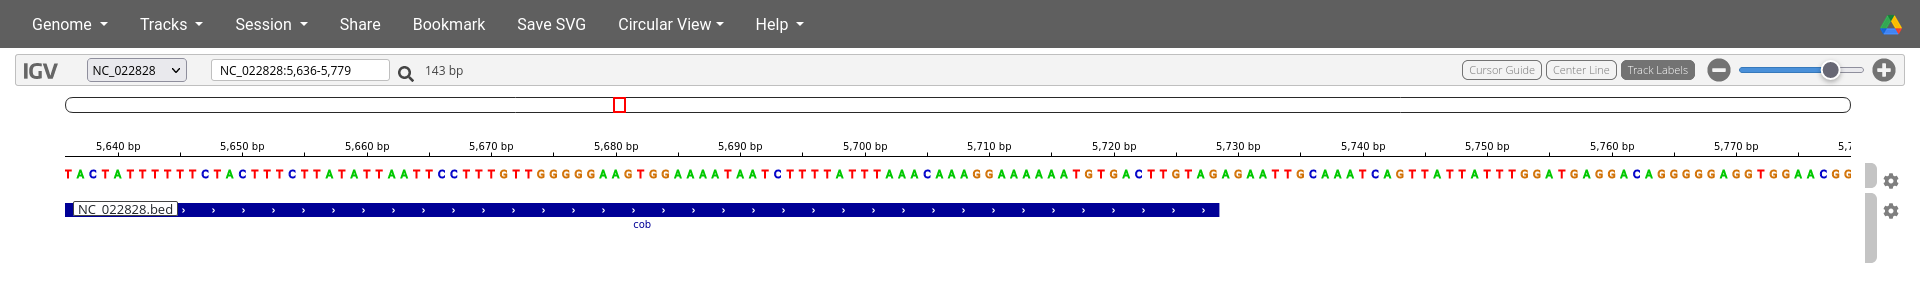
IGV Viewer output for mitogenome NC_022828 of the DeGeCI annotation example. The genome is displayed in the top row. By zooming in, colors become visible on this row (second and third image). These colors encode the different nucleotides (e.g., T=red, A=green, C=blue, G=brown). By zooming in further, the indiviual nucleotides become visible (third image). The second and thrid row show the annotated genes on the positive and negative strand, respectively. In this case the third row is empty because all genes are annotated on the positive strand. Instructions
- Go to IGV.
- Remove all currently loaded example data.
- Click on "Genome" → "Local File" and upload the genome sequence. To do so, select the sequence as FASTA and indexed FASTA file (this allows to also load large genomes). If you do not have an indexed FASTA file of your genome, you can for example generate it using the fastahack software.
- Click on "Tracks" → "Local File" and upload the BED file produced by DeGeCI 1.1 (the file with extension "bed").
To assure the website is up and running we run hourly cronjobs. We also run a short maintenance job every sunday at 0pm (GMT+1) during which the site will be down for 1 minute.
The reference database is updated based on the currently available material and personal resources of our faculty.Despite our best efforts, it is of course possible that you might encounter some sort of misbehaviour on our website. In this case, please report to lfiedler@informatik.uni-leipzig.de.
- Q: How are the results provided?
A: Once you have submitted your input genome, you can stay on the page or bookmark it, the link to the result files will appear there, once the results are ready. - Q: Do you provide the results in other formats?
A: Currently not. - Q: How long are the results kept?
A: Your results will automatically be removed after 5 days. - Q: Can I also annotate incomplete genomes?
A: Yes, this is basically possible. However, note that DeGeCI is optimized for annotating complete genomes, so the results might be of lower quality. Also note, that the minimum length is 50 nt. - Q: Who do I report to in case of misbehaviour?
A: please report to lfiedler@informatik.uni-leipzig.de - Q: How do I cite DeGeCI?
A: Please cite:
Fiedler L., Middendorf M. and Bernt M. (2023) Fully automated annotation of mitochondrial genomes using a cluster-based approach with de Bruijn graphs. Front. Genet. 14:1250907. doi: 10.3389/fgene.2023.1250907